人工智能和数据科学的七大 Python 库
本文作者Favio Vázquez从2018年开始发布《数据科学和人工智能每周文摘:Python & R》系列文章,为数据科学家介绍最好的库、repos、packages以及工具。
一年结束,作者列出了2018年的7大最好的Python库,这些库确实地改进了研究人员的工作方式。

7. AdaNet ———快速灵活的AutoML框架

https://github.com/tensorflow/adanet
AdaNet是一个轻量级的、可扩展的TensorFlow AutoML框架,用于使用AdaNet算法训练和部署自适应神经网络[Cortes et al. ICML 2017]。AdaNet结合了多个学习子网络,以减轻设计有效的神经网络所固有的复杂性。
这个软件包将帮助你选择最优的神经网络架构,实现一种自适应算法,用于学习作为子网络集合的神经架构。
你需要了解TensorFlow才能使用这个包,因为它实现了TensorFlow Estimator,但这将通过封装训练、评估、预测和导出服务来帮助你简化机器学习编程。
你可以构建一个神经网络的集合,这个库将帮助你优化一个目标,以平衡集合在训练集上的性能和将其泛化到未见过数据的能力之间的权衡。
安装
安装adanet之前需将TensorFlow升级到1.7或以上:
$ pip install "tensorflow>=1.7.0"
从源代码安装
要从源代码进行安装,首先需要安装bazel。
下一步,复制adanet和cd到它的根目录:
$ git clone https://github.com/tensorflow/adanet && cd adanet
从adanet根目录运行测试:
$ cd adanet
$ bazel test -c opt //...
确认一切正常后,将adanet安装为pip包。
现在,可以对adanet进行试验了。
import adanet
用法

有关AdaNet的详细用法,请阅读官方教程:
https://github.com/tensorflow/adanet/tree/master/adanet/examples/tutorials
https://ai.googleblog.com/2018/10/introducing-adanet-fast-and-flexible.html?m=1
6. TPOT——一个自动化的Python机器学习工具

https://github.com/EpistasisLab/tpot
之前我介绍过Auto-Keras,这是一个很棒的AutoML库。现在我们有另一个非常有趣的工具——TPOT。
TPOT全称是基于树的pipeline优化工具(Tree-based Pipeline Optimization Tool),这是一个非常棒Python自动机器学习工具,使用遗传编程优化机器学习pipeline。

TPOT可以自动化许多东西,包括生命特性选择、模型选择、特性构建等等。如果你是Python机器学习者,很幸运,TPOT是构建在Scikit-learn之上的,所以它生成的所有代码看起来应该很熟悉。
它的作用是通过智能地探索数千种可能的pipeline来自动化机器学习中最繁琐的部分,找到最适合你的数据的pipeline,然后为你提供最佳的 Python 代码。
它的工作原理如下:

安装
安装TPOT之前,请先阅读教程:
http://epistasislab.github.io/tpot/installing/
然后,运行以下代码:
- pip install tpot
例子:
首先让我们从基本的Iris数据集开始:
- 1from tpot import TPOTClassifier
- 2from sklearn.datasets import load_iris
- 3from sklearn.model_selection import train_test_split
- 4
- 5# Load iris dataset
- 6iris = load_iris()
- 7
- 8# Split the data
- 9
- 10X_trainX_train, X_test, y_train, y_test = train_test_split(iris.data, iris.target,
- 11 train_size=0.75, test_size=0.25)
- 12
- 13# Fit the TPOT classifier
- 14
- 15tpot = TPOTClassifier(verbosity=2, max_time_mins=2)
- 16tpot.fit(X_train, y_train)
- 17
- 18# Export the pipeline
- 19tpot.export('tpot_iris_pipeline.py')
我们在这里构建了一个非常基本的TPOT pipeline,它将尝试寻找最佳ML pipeline来预测iris.target。然后保存这个pipeline。之后,我们要做的就非常简单了——加载生成的.py文件,你将看到:
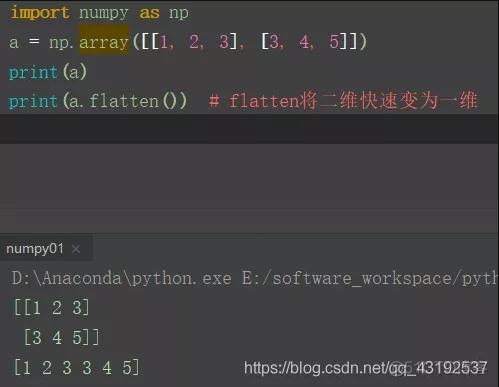
- 1import numpy as np
- 2from sklearn.kernel_approximation import RBFSampler
- 3from sklearn.model_selection import train_test_split
- 4from sklearn.pipeline import make_pipeline
- 5from sklearn.tree import DecisionTreeClassifier
- 6# NOTE: Make sure that the class is labeled 'class' in the data file
- 7tpot_data = np.recfromcsv('PATH/TO/DATA/FILE', delimiter='COLUMN_SEPARATOR', dtype=np.float64)
- 8features = np.delete(tpot_data.view(np.float64).reshape(tpot_data.size, -1), tpot_data.dtype.names.index('class'), axis=1)
- 9training_features, testing_features, training_classes, testing_classes =
- 10 train_test_split(features, tpot_data['class'], random_state=42)
- 11exported_pipeline = make_pipeline(
- 12 RBFSampler(gamma=0.8500000000000001),
- 13 DecisionTreeClassifier(criterion="entropy", max_depth=3, min_samples_leaf=4, min_samples_split=9)
- 14)
- 15exported_pipeline.fit(training_features, training_classes)
- 16results = exported_pipeline.predict(testing_features)
就是这样。你已经以一种简单但强大的方式为Iris数据集构建一个分类器。
现在我们来看看MNIST的数据集:
- 1from tpot import TPOTClassifier
- 2from sklearn.datasets import load_digits
- 3from sklearn.model_selection import train_test_split
- 4
- 5# load and split dataset
- 6digitsdigits == load_digitsload_di ()
- 7X_train, X_test, y_train, y_test = train_test_split(digits.data, digits.target,
- 8 train_size=0.75, test_size=0.25)
- 9
- 10# Fit the TPOT classifier
- 11tpot = TPOTClassifier(verbosity=2, max_time_mins=5, population_size=40)
- 12tpot.fit(X_train, y_train)
- 13
- 14# Export pipeline
- 15tpot.export('tpot_mnist_pipeline.py')
接下来我们再次加载生成的 .py文件,你将看到:
- 1import numpy as np
- 2from sklearn.model_selection import train_test_split
- 3from sklearn.neighbors import KNeighborsClassifier
- 4# NOTE: Make sure that the class is labeled 'class' in the data file
- 5tpot_data = np.recfromcsv('PATH/TO/DATA/FILE', delimiter='COLUMN_SEPARATOR', dtype=np.float64)
- 6features = np.delete(tpot_data.view(np.float64).reshape(tpot_data.size, -1), tpot_data.dtype.names.index('class'), axis=1)
- 7training_features, testing_features, training_classes, testing_classes =
- 8 train_test_split(features, tpot_data['class'], random_state=42)
- 9exported_pipeline = KNeighborsClassifier(n_neighbors=4, p=2, weights="distance")
- 10exported_pipeline.fit(training_features, training_classes)
- 11results = exported_pipeline.predict(testing_features)
5. SHAP ——一个解释任何机器模型输出的统一方法

https://github.com/slundberg/shap
解释机器学习模型并不容易。然而,它对许多商业应用程序来说非常重要。幸运的是,有一些很棒的库可以帮助我们完成这项任务。在许多应用程序中,我们需要知道、理解或证明输入变量在模型中的运作方式,以及它们如何影响最终的模型预测。
SHAP (SHapley Additive exPlanations)是一种解释任何机器学习模型输出的统一方法。SHAP将博弈论与局部解释联系起来,并结合了之前的几种方法。
安装
SHAP可以从PyPI安装
- pip install shap
或conda -forge
- conda install -c conda-forge shap
用法
有很多不同的模型和方法可以使用这个包。在这里,我将以DeepExplainer中的一个例子为例。
Deep SHAP是深度学习模型中SHAP值的一种高速近似算法,它基于与DeepLIFT的连接,如SHAP的NIPS论文所述(https://arxiv.org/abs/1802.03888)。
下面这个例子可以看到SHAP如何被用来解释MNIST数据集的Keras模型结果:
- # this is the code from https://github.com/keras-team/keras/blob/master/examples/mnist_cnn.py
- from __future__ import print_function
- import keras
- from keras.datasets import mnist
- from keras.models import Sequential
- from keras.layers import Dense, Dropout, Flatten
- from keras.layers import Conv2D, MaxPooling2D
- from keras import backend as K
- batch_size = 128
- num_classes = 10
- epochs = 12
- # input image dimensions
- img_rows, img_cols = 28, 28
- # the data, split between train and test sets
- (x_train, y_train), (x_test, y_test) = mnist.load_data()
- if K.image_data_format() == 'channels_first':
- x_train = x_train.reshape(x_train.shape[0], 1, img_rows, img_cols)
- x_test = x_test.reshape(x_test.shape[0], 1, img_rows, img_cols)
- input_shape = (1, img_rows, img_cols)
- else:
- x_train = x_train.reshape(x_train.shape[0], img_rows, img_cols, 1)
- x_test = x_test.reshape(x_test.shape[0], img_rows, img_cols, 1)
- input_shape = (img_rows, img_cols, 1)
- x_train = x_train.astype('float32')
- x_test = x_test.astype('float32')
- x_train /= 255
- x_test /= 255
- print('x_train shape:', x_train.shape)
- print(x_train.shape[0], 'train samples')
- print(x_test.shape[0], 'test samples')
- # convert class vectors to binary class matrices
- y_train = keras.utils.to_categorical(y_train, num_classes)
- y_test = keras.utils.to_categorical(y_test, num_classes)
- model = Sequential()
- model.add(Conv2D(32, kernel_size=(3, 3),
- activation='relu',
- input_shape=input_shape))
- model.add(Conv2D(64, (3, 3), activation='relu'))
- model.add(MaxPooling2D(pool_size=(2, 2)))
- model.add(Dropout(0.25))
- model.add(Flatten())
- model.add(Dense(128, activation='relu'))
- model.add(Dropout(0.5))
- model.add(Dense(num_classes, activation='softmax'))
- model.compile(loss=keras.losses.categorical_crossentropy,
- optimizer=keras.optimizers.Adadelta(),
- metrics=['accuracy'])
- model.fit(x_train, y_train,
- batch_size=batch_size,
- epochs=epochs,
- verbose=1,
- validation_data=(x_test, y_test))
- score = model.evaluate(x_test, y_test, verbose=0)
- print('Test loss:', score[0])
- print('Test accuracy:', score[1])
更多示例:
https://github.com/slundberg/shap#sample-notebooks
4. Optimus——使用 Python 和 Spark 轻松实现敏捷数据科学工作流

https://github.com/ironmussa/Optimus
Optimus V2旨在让数据清理更容易。这个API的设计对新手来说超级简单,对使用pandas的人来说也非常熟悉。Optimus扩展了Spark DataFrame功能,添加了.rows和.cols属性。
使用Optimus,你可以以分布式的方式清理数据、准备数据、分析数据、创建分析器和图表,并执行机器学习和深度学习,因为它的后端有Spark、TensorFlow和Keras。
Optimus是数据科学敏捷方法的完美工具,因为它几乎可以帮助你完成整个过程的所有步骤,并且可以轻松地连接到其他库和工具。
Installation (pip):
- pip install optimuspyspark
用法
在这个示例中,你可以从 URL 加载数据,对其进行转换,并应用一些预定义的清理功能:
- from optimus import Optimus
- op = Optimus()
- # This is a custom function
- def func(value, arg):
- return "this was a number"
- df =op.load.url("https://raw.githubusercontent.com/ironmussa/Optimus/master/examples/foo.csv")
- df
- .rows.sort("product","desc")
- .cols.lower(["firstName","lastName"])
- .cols.date_transform("birth", "new_date", "yyyy/MM/dd", "dd-MM-YYYY")
- .cols.years_between("birth", "years_between", "yyyy/MM/dd")
- .cols.remove_accents("lastName")
- .cols.remove_special_chars("lastName")
- .cols.replace("product","taaaccoo","taco")
- .cols.replace("product",["piza","pizzza"],"pizza")
- .rows.drop(df["id"]<7)
- .cols.drop("dummyCol")
- .cols.rename(str.lower)
- .cols.apply_by_dtypes("product",func,"string", data_type="integer")
- .cols.trim("*")
- .show()
你可以将这个表格

转换为这样:

是不是很酷?这个库还可以做更多事情,具体请阅读:
https://www.hioptimus.com/
3. spacy——使用Python和Cython的工业级自然语言处理

https://spacy.io/
spaCy旨在帮助你完成实际的工作——构建真实的产品,或收集真实的见解。这个库尊重你的时间,尽量避免浪费。它易于安装,而且它的API简单而高效。spaCy被视为自然语言处理的Ruby on Rails。
spaCy是为深度学习准备文本的最佳方法。它与TensorFlow、PyTorch、Scikit-learn、Gensim以及Python强大的AI生态系统的其他部分无缝交互。使用spaCy,你可以很容易地为各种NLP问题构建语言复杂的统计模型。
安装
- pip3 install spacy
- $ python3 -m spacy download en
这里,我们还下载了英语语言模型。你可以在这里找到德语,西班牙语,意大利语,葡萄牙语,法国语等版本的模型:
https://spacy.io/models/
下面是主页面的一个示例:
- # python -m spacy download en_core_web_sm
- import spacy
- # Load English tokenizer, tagger, parser, NER and word vectors
- nlp = spacy.load('en_core_web_sm')
- # Process whole documents
- text = (u"When Sebastian Thrun started working on self-driving cars at "
- u"Google in 2007, few people outside of the company took him "
- u"seriously. “I can tell you very senior CEOs of major American "
- u"car companies would shake my hand and turn away because I wasn’t "
- u"worth talking to,” said Thrun, now the co-founder and CEO of "
- u"online higher education startup Udacity, in an interview with "
- u"Recode earlier this week.")
- doc = nlp(text)
- # Find named entities, phrases and concepts
- for entity in doc.ents:
- print(entity.text, entity.label_)
- # Determine semantic similarities
- doc1 = nlp(u"my fries were super gross")
- doc2 = nlp(u"such disgusting fries")
- similarity = doc1.similarity(doc2)
- print(doc1.text, doc2.text, similarity)
在这个示例中,我们首先下载English tokenizer, tagger, parser, NER和word vectors。然后创建一些文本,打印找到的实体、短语和概念,最后确定两个短语的语义相似性。运行这段代码,你会得到:
- Sebastian Thrun PERSON
- Google ORG
- 2007 DATE
- American NORP
- Thrun PERSON
- Recode ORG
- earlier this week DATE
- my fries were super gross such disgusting fries 0.7139701635071919
2. jupytext

对我来说,jupytext是年度最佳。几乎所有人都在像Jupyter这样的笔记本上工作,但是我们也在项目的更核心部分使用像PyCharm这样的IDE。
好消息是,你可以在自己喜欢的IDE中起草和测试普通脚本,在使用Jupytext时可以将IDE作为notebook在Jupyter中打开。在Jupyter中运行notebook以生成输出,关联.ipynb表示,并作为普通脚本或传统Jupyter notebook 进行保存和分享。
下图展示了这个包的作用:
可点击下方链接查看原文中的GIF展示:
https://heartbeat.fritz.ai/top-7-libraries-and-packages-of-the-year-for-data-science-and-ai-python-r-6b7cca2bf000
安装
- pip install jupytext --upgrade
然后,配置Jupyter使用Jupytext:
使用jupyter notebook --generate-config生成Jupyter配置
编辑.jupyter/jupyter_notebook_config.py,并附加以下代码:
- c.NotebookApp.contents_manager_class = "jupytext.TextFileContentsManager"
重启Jupyter,即运行:
- jupyter notebook
你可以在这里试试:
https://mybinder.org/v2/gh/mwouts/jupytext/master?filepath=demo
1.Chartify ——让数据科学家很容易创建图表的Python库

https://xkcd.com/1945/
Chartify是Python的年度最佳库。
在Python世界中创建一个像样的图很费时间。幸运的是,我们有像Seaborn之类的库,但问题是他们的plots不是动态的。
然后就出现了Bokeh——这是一个超棒的库,但用它来创造互动情节仍很痛苦。
Chartify建立在Bokeh之上,但它简单得多。
Chartify的特性:
- 一致的输入数据格式:转换数据所需的时间更少。所有绘图函数都使用一致、整洁的输入数据格式。
- 智能默认样式:创建漂亮的图表,几乎不需要自定义。
- 简单API:API尽可能直观和容易学习。
- 灵活性:Chartify是建立在Bokeh之上的,所以如果你需要更多的控制,你可以使用Bokeh的API。
安装
Chartify可以通过pip安装:
- pip3 install chartify
用法
假设我们想要创建这个图表:

- import pandas as pd
- import chartify
- # Generate example data
- data = chartify.examples.example_data()
现在,我们已经加载了一些示例数据,让我们来做一些转换:
- total_quantity_by_month_and_fruit = (data.groupby(
- [data['date'] + pd.offsets.MonthBegin(-1), 'fruit'])['quantity'].sum()
- .reset_index().rename(columns={'date': 'month'})
- .sort_values('month'))
- print(total_quantity_by_month_and_fruit.head())
- month fruit quantity
- 0 2017-01-01 Apple 7
- 1 2017-01-01 Banana 6
- 2 2017-01-01 Grape 1
- 3 2017-01-01 Orange 2
- 4 2017-02-01 Apple 8
现在我们可以把它画出来:
- # Plot the data
- ch = chartify.Chart(blank_labels=True, x_axis_type='datetime')
- ch.set_title("Stacked area")
- ch.set_subtitle("Represent changes in distribution.")
- ch.plot.area(
- data_frame=total_quantity_by_month_and_fruit,
- x_column='month',
- y_column='quantity',
- color_column='fruit',
- stacked=True)
- ch.show('png')
超级容易创建一个互动的plot。
更多示例:


https://github.com/spotify/chartify

时间:2019-01-11 12:56 来源: 转发量:次
声明:本站部分作品是由网友自主投稿和发布、编辑整理上传,对此类作品本站仅提供交流平台,转载的目的在于传递更多信息及用于网络分享,并不代表本站赞同其观点和对其真实性负责,不为其版权负责。如果您发现网站上有侵犯您的知识产权的作品,请与我们取得联系,我们会及时修改或删除。
相关文章:
相关推荐:
网友评论: